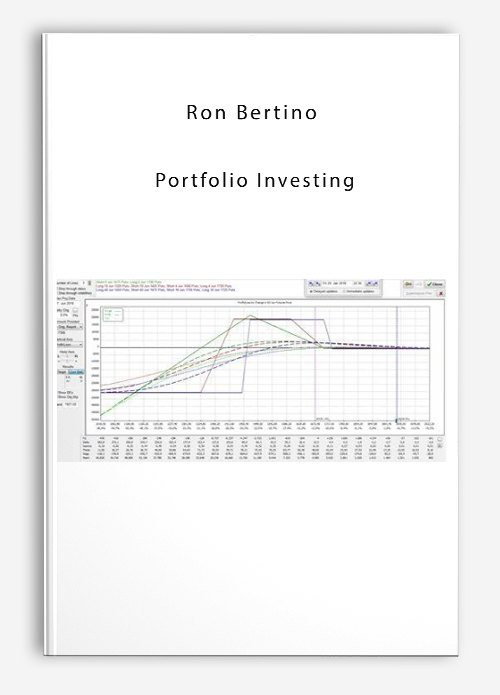
Ron Bertino – Portfolio Investing
$59.00
One of the objectives of the Portfolio Investing course is to present everything without delving into programming code.
Portfolio Investing has been meticulously designed, ensuring that when followed in the suggested sequence, it yields the most effective and efficient learning experience.
Who is Ron Bertino? Ron, the founder of Trading Dominion, established it with the aim of offering high-level options training and education to individuals aspiring to elevate their trading skills. He provides courses covering algorithmic trading, advanced option trading, and diversified ETF portfolio trading. Ron is the creator of the Space Trip Trade (STT) and the Black Swan Hedge (BSH). He teaches people how to leverage portfolio or SPAN margin to not only enhance their returns but also bolster their trading safety.
What was mentioned by Ron Bertino? I reflected back on the period from 2008 to 2009, during the financial crisis, while I was employed by a major IT consulting firm.
I had a substantial sum of money in a 401K retirement account, and the only means of managing the funds was to select from a range of portfolios they had assembled.
At that time, I did what nearly everyone does, which is simply choosing a few funds that seemed to perform well and had relatively modest historical drawdowns.
However, over the 2008-2009 period, my entire 401K retirement account saw a decline of approximately 45%. Where was the diversification they claimed would shield the portfolio from such a significant drawdown?
It was quite agonizing to witness, yet the fund managers of these accounts still collected their management fees.
Portfolio Investing with Ron Bertino In General
Welcome Distinguishing Between Strategic and Tactical Asset Allocation Introduction to Bonds Asset Categories Hedge Funds Deceptive Aspects of Data Returns
Commencing Historical Data Linear vs. Logarithmic Scale Arithmetic and Logarithmic Price Returns Accumulated Arithmetic and Logarithmic Price Returns Conversion of Arithmetic and Logarithmic Returns Arithmetic and Geometric Mean Wealth Index Performance Graphs Risk Assessment
Variance and Standard Deviation The Portfolio Impact Sharpe Ratio, Calmar Ratio, Sortino Ratio, Martin Ratio Alpha and Beta Correlation and R-Squared Information and Treynor Ratio Value-at-Risk and Expected Shortfall Factor Models
Capital Asset Pricing Model (CAPM) Fama French 3-Factor Model Permanent Portfolios
Equal and Value-Weighted Portfolios Calculation of Portfolio Returns Review of 5 Distinct Permanent Portfolios Moving Average Filters
M.A.F. – Single Asset M.A.F. – All Assets in a Portfolio Modern Portfolio Theory
Introduction to MPT Correlation and the Correlation Matrix Efficient Frontier Minimum Variance Portfolio and Mean-Variance Efficient Portfolios Rebalancing Return vs. Risk Graph Capital Allocation Line and Margin Impact on Returns Kelly Criterion – Optimal F Inverse Variance Portfolio Risk Parity Portfolio Dual Momentum
Review of 6 Different Dual Momentum Portfolios Other Portfolios
Review of Two Adaptive Allocation Portfolios Review of Two Core-Satellite Portfolios Spreadsheets and Automation We utilize Google Sheets, a free technology, to construct spreadsheets that illustrate the concepts presented in the training.
Stock Analysis Spreadsheet
Utilizing multiple sources to import historical data Calculation of arithmetic and logarithmic returns (both standard and cumulative) Generation of performance graphs in both linear and logarithmic scales Analysis of drawdowns Calculation of various performance and risk statistics Generation of a pivot table and bar graph depicting historical monthly performance Displaying return frequencies and mapping them to a normal distribution curve for visualizing skew and kurtosis (Do not worry if the above terminology seems complex at the moment. By the end of the course, you will have a clear understanding of their meanings and operations.)
Conversion Spreadsheets
One spreadsheet will take the output from one of the online portfolio backtesting tools we will use and convert it into a clean time series for more detailed testing.
The second spreadsheet will perform a similar task, but it will take calendar-style returns as input and convert them into a clean time series for further analysis.
Comparison Spreadsheet
This spreadsheet will take the logarithmic returns of the clean time series data we have created and compare the results of two different portfolios side by side, along with relevant statistics.
Google Apps Script Automation Code
One of the objectives of the Portfolio Investing course is to present everything without delving into programming code.
Nevertheless, I have developed Google Apps Script automation code that will significantly aid in the aforementioned steps related to conversion and comparison spreadsheets. I do not delve into explaining the Google Apps Script coding, but I make the complete source code available for those interested in using it as a reference for their own spreadsheet automation endeavors.
More courses from this author: Ron Bertino
Be the first to review “Ron Bertino – Portfolio Investing” Cancel reply
Related products
Forex - Trading & Investment
Forex - Trading & Investment
Mike McMahon – Professional Trader Series DVD Set (Full) (tradingacademy.com)
Forex - Trading & Investment
Nick Van Nice & John Sheely – Master CTS Swing Trading (Video & Manual)
Forex - Trading & Investment
Michael Parsons – Channel Surfing Video Course (Manual,Video)
Forex - Trading & Investment
Justine Williams-Lara – Counting Elliott Waves. The Profitunity Way DVD (with Russian subtitles)





Reviews
There are no reviews yet.